This is a UI for several spectrometers:
- Torch Bearer Spectrometer (
Y21B7W10034CCPD) that is available on Amazon and AliExpress (TB Store) - Ocean Optics Flame-S, USB4000 (and maybe others)
Originally forked from ZoidTechnology/Torch-Bearer-Tools1 and improved (beyond recognition).
It also supports displaying its own json saves and importing csv data from
yet another Chinese range of spectrometers (Hopoocolor HPCS-320, HPCS-330).
pipx install tobes-ui
or:
pip install tobes-ui
If you want support for Ocean Optics, you also need to install tobes-ui[ocean],
and also (for Linux and Windows) follow the
OS support instructions
on python-seabreeze.
usage: main.py [-h] [-b] [-L] [-e EXPOSURE] [-q | -t GRAPH_TYPE] [-o | -n]
               [-f FILE_TEMPLATE] [-d [DATA ...]] [-s HISTORY_SIZE] [-l LOG_LEVEL]
               [--log-file LOG_FILE] [-m MODE]
               [input_device]

Totally Bearable Spectrometer UI

positional arguments:
  input_device          Spectrometer device (dev:string); ; e.g. /dev/ttyUSB0, or
                        type:/dev/foo (registered types: fake, fake-spectrometer, oo, ocean,
                        oceanoptics, tb, torchbearer)

options:
  -h, --help            show this help message and exit
  -b, --backends        List all spectrometer backends
  -L, --loaders         List all file loaders
  -e, --exposure EXPOSURE
                        Exposure time in milliseconds (0.1-5000) or 'auto' (default: auto)
  -q, --quick-graph     Enable quick (LINE) graph mode
  -t, --graph_type GRAPH_TYPE
                        Graph type (LINE, SPECTRUM, CIE1931, CIE1960UCS, CIE1976UCS, TM30,
                        OVERLAY) (default SPECTRUM)
  -o, --oneshot         One shot mode (single good capture)
  -n, --no-refresh      Start without refresh
  -f, --file_template FILE_TEMPLATE
                        File template (without .ext) for data export (default:
                        'spectrum-{timestamp_full}{graph_type}'),
                        '{name}-{timestamp_full}{graph_type}' might be also useful
  -d, --data [DATA ...]
                        File(s) to load for viewing (disables data refresh); (loaders: hpcs,
                        json)
  -s, --history-size HISTORY_SIZE
                        Size of the measurement history (default: 50)
  -l, --log-level LOG_LEVEL
                        Logging level to configure: DEBUG, INFO, WARN, ERROR, FATAL (default
                        WARN)
  --log-file LOG_FILE   Logfile to write to (defaults to none (=console))
  -m, --mode MODE       Mode to run in: PLOT, WLC (default PLOT)
usage: main.py [-h] [-b] [-L] [-e EXPOSURE] [-q | -t GRAPH_TYPE] [-o | -n]
               [-f FILE_TEMPLATE] [-d [DATA ...]] [-s HISTORY_SIZE] [-l LOG_LEVEL]
               [--log-file LOG_FILE] [-m MODE]
               [input_device]
My typical use is:
# To gather new data from Torch Bearer:
python3 -m tobes_ui.main /dev/ttyUSB0 -e auto -o
# or (if you use pipx): tobes-ui /dev/...
# To gather new data from Ocean Optics:
python3 -m tobes_ui.main oo: -e auto -o
# To "replay" existing samples:
python3 -m tobes_ui.main -d examples/*.json
# or (if you use pipx): tobes-ui -d ...
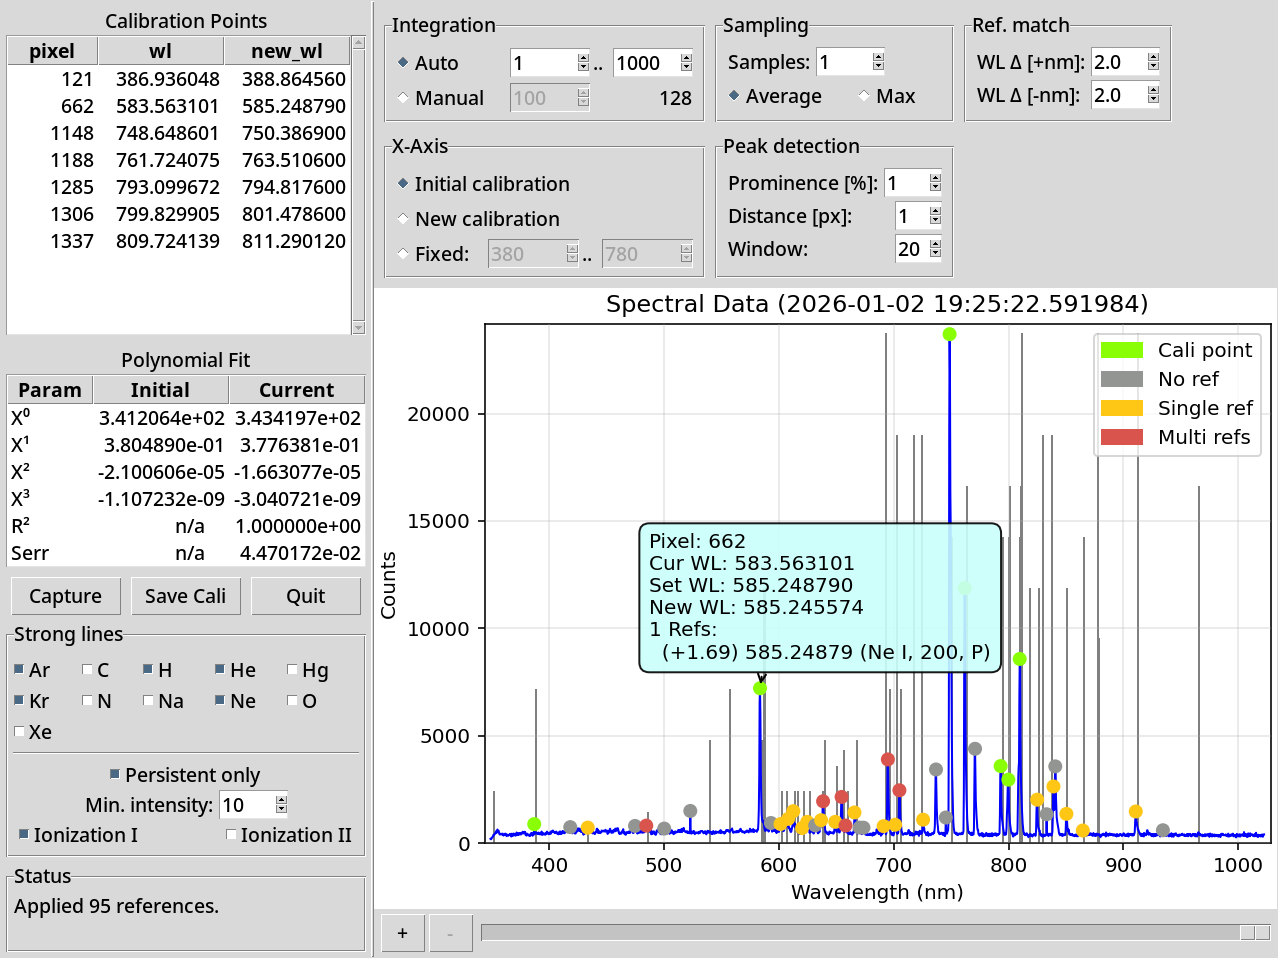
# To wavelength calibrate (OO only):
python3 -m tobes_ui.main oo: -m wlc
# To wavelength calibrate using fake (replay) spectrometer
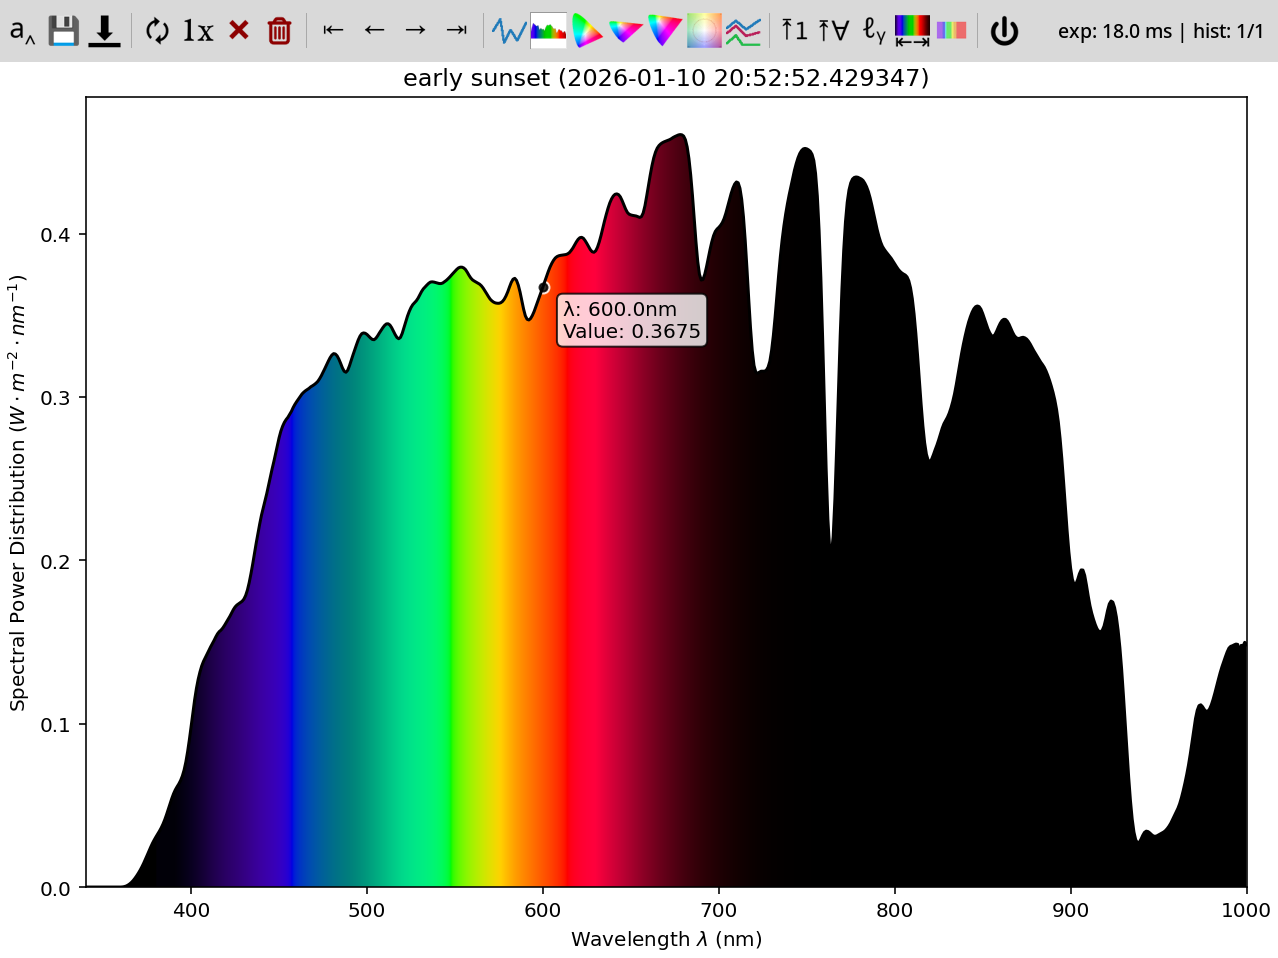
python3 -m tobes_ui.main fake:examples/cali-sample.json -m wlcThe first invocation gives one-shot spectrum on auto exposure (from /dev/ttyUSB0):
Or, if you prefer, screenshot of the CIE1976UCS locus or screenshot of the TM30 graph.
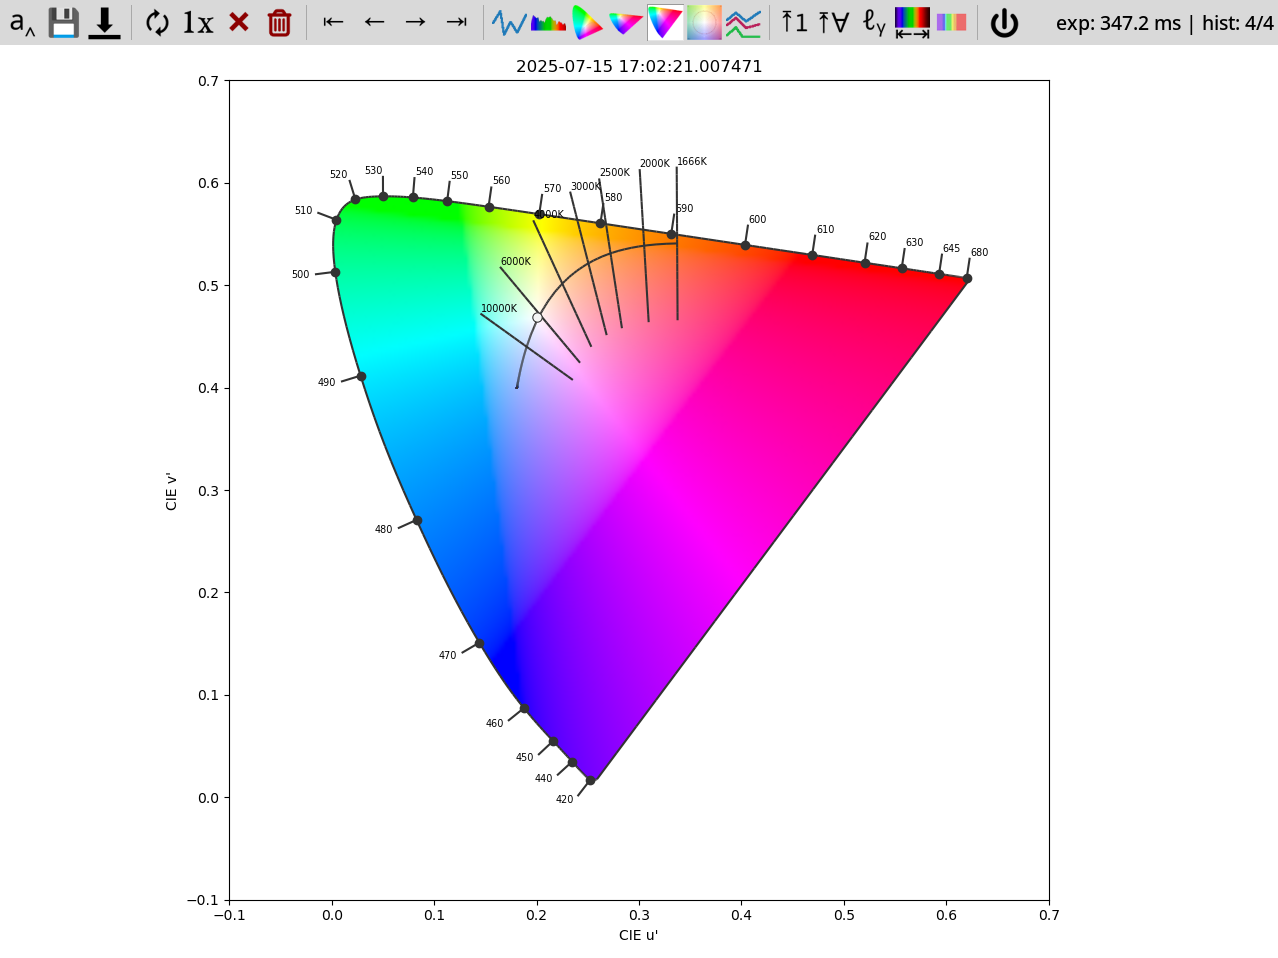
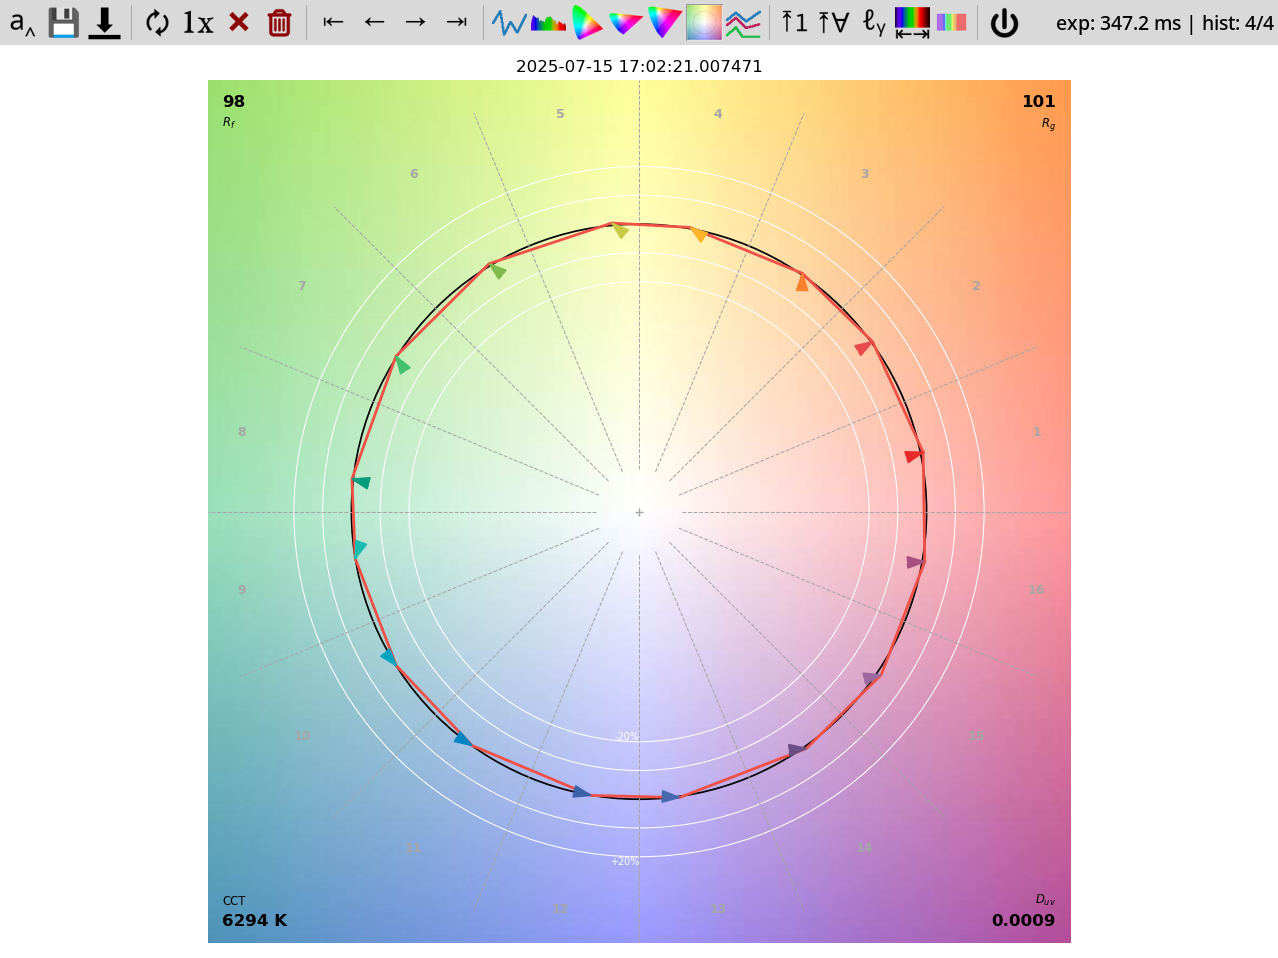
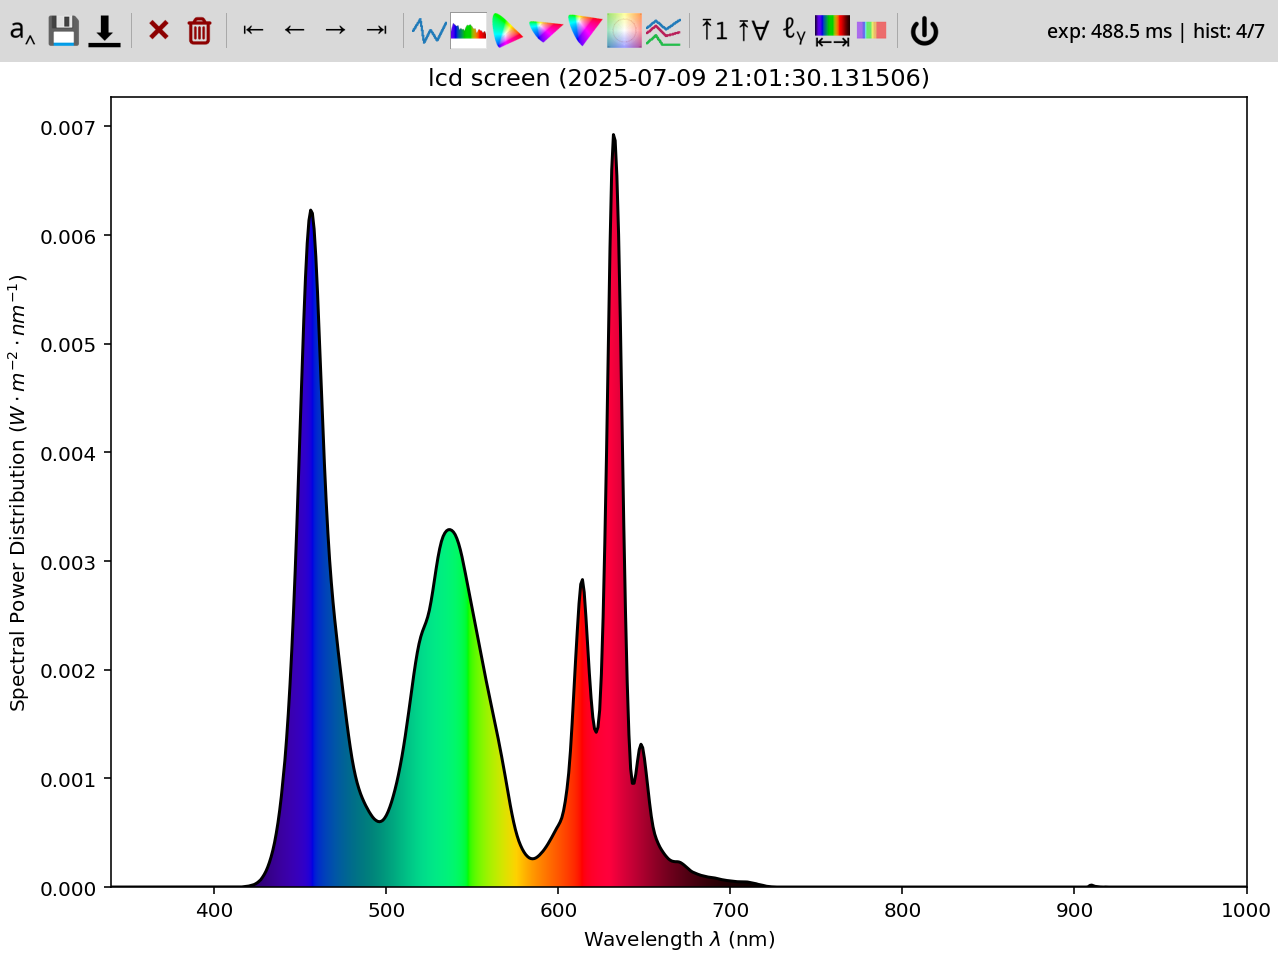
The "replay" invocation shows you saved data from examples (no spectrometer needed!):
The "wavelength calibration" allows you to calibrate wavelength of supported spectrometers (currently only Ocean Optics or fake (replay) spectrometer):
There are several icons on the toolbar:
| Icon | Key | Explanation |
|---|---|---|
Enter, A |
Name the current spectrum data | |
S |
Saves rendered graph as png | |
D |
Save raw data as json | |
R |
Keep refreshing data | |
1, O |
One good acquisition | |
Delete, X |
Remove the current spectrum data (from UI) | |
- |
Remove all the spectrum data (from UI) | |
Home, H |
Go to start of history | |
←, P |
Go to previous sample | |
→, N |
Go to next sample | |
End, E |
Go to end of history | |
Q, L |
Line graph | |
C |
Spectrum graph (slow to draw) | |
3 |
CIE1931 locus graph | |
6 |
CIE1960UCS locus graph | |
7 |
CIE1976UCS locus graph | |
T |
TM30 graph | |
V |
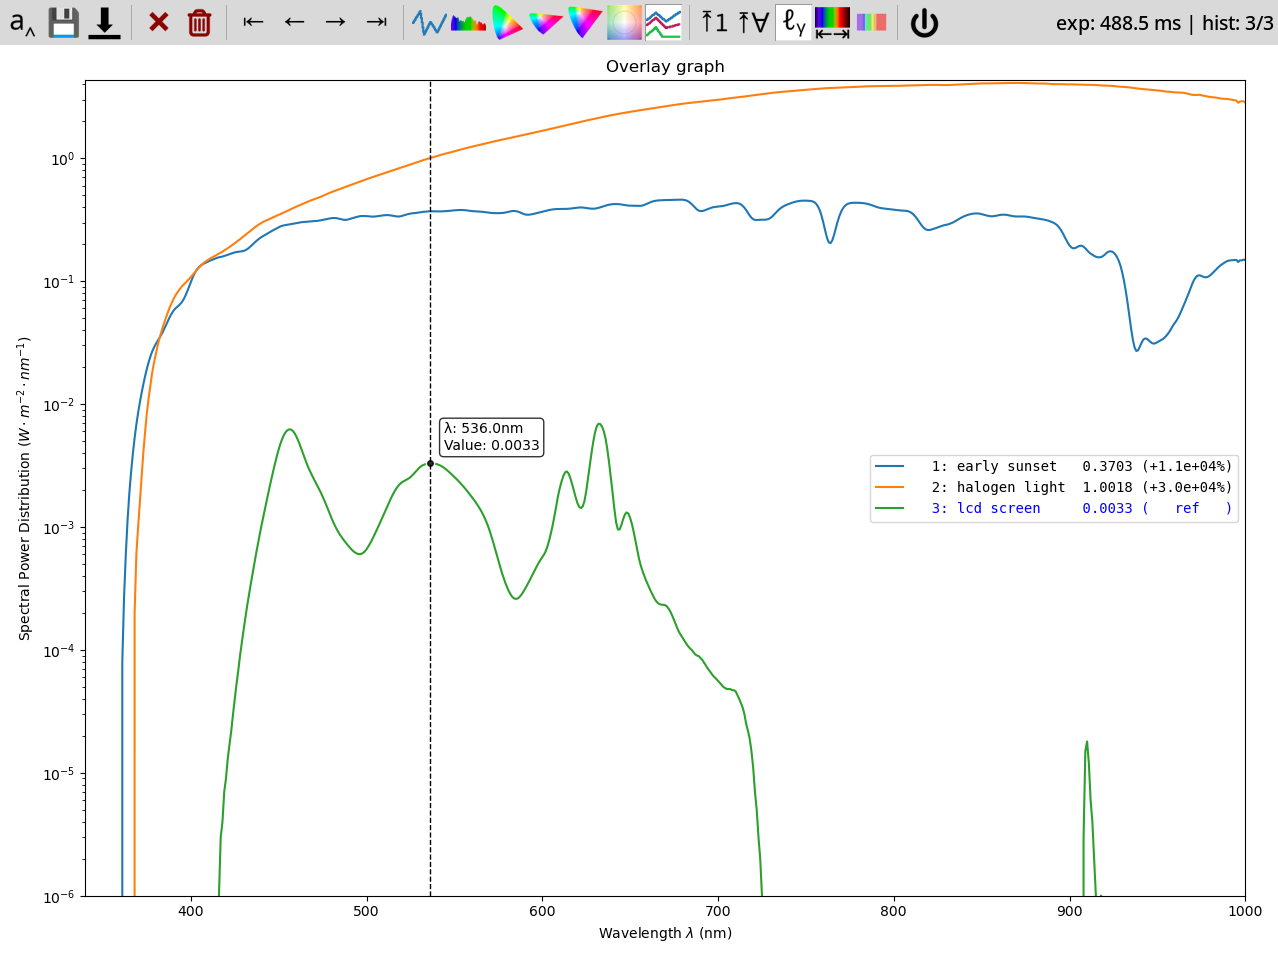
Overlay graph -- all spectra at once | |
Y |
Only line+spectrum: Fix Y-axis range based on current graph | |
G |
Only line+spectrum: Fix Y-axis range based on all graphs | |
K |
Only line+overlay: Use logarithmic Y-axis | |
Z |
Only line, spectrum, overlay: Limit X axis to visible spectrum (380..750 nm) | |
| |
Only line, overlay: Show spectrum + photosensitivities overlay | |
Esc, Ctrl+Q |
Quit the app |
Sample exported data:
{
    "status": "normal",
    "exposure": "automatic",
    "time": 329.1,
    "spd": {
        "340": 0.0,
        "341": 0.0,
        "...": "......",
        "595": 0.013011,
        "596": 0.013095,
        "597": 0.013176,
        "598": 0.013251,
        "599": 0.013318,
        "600": 0.013385,
        "601": 0.01345,
        "602": 0.013515,
        "603": 0.013575,
        "604": 0.013621,
        "605": 0.013648,
        "...": "......",
        "995": 0.005143,
        "996": 0.005075,
        "997": 0.005119,
        "998": 0.004982,
        "999": 0.004944,
        "1000": 0.004859
    },
    "wavelength_range": [
        340,
        1000
    ],
    "wavelengths_raw": [
        340,
        341,
        "...",
        999,
        1000
    ],
    "spd_raw": [
        0.0,
        0.0,
        "......",
        0.013011,
        0.013095,
        0.013176,
        0.013251,
        0.013318,
        0.013385,
        0.01345,
        0.013515,
        0.013575,
        0.013621,
        0.013648,
        "......",
        0.005143,
        0.005075,
        0.005119,
        0.004982,
        0.004944,
        0.004859
    ],
    "ts": 1751704901.025932,
    "name": "my fancy spectrum",
    "y_axis": "$W\\cdot{}m^{-2}\\cdot{}nm^{-1}$",
    "device": "Y21B7W10034CCPD",
    "meta": {
        "key": "value"
    }
}
Meaning of the keys:
| Key | Type | Default | Meaning |
|---|---|---|---|
| status | enum | required | Status of the exposure (normal, over, under) |
| exposure | enum | required | Type of the exposure (manual, automatic) |
| time | float | required | Time (ms) of the exposure |
| spd | dict[int, float] | required | Dictionary of wavelength: intensity |
| wavelength_range | range | from spd | Range of spd |
| wavelengths_raw | list[float] | None | Raw wavelengths (device-specific) |
| spd_raw | list[float] | None | Raw intensities (device-specific) |
| ts | unix ts | required | Time when the measurement took place |
| name | str | None | Human name for the measurement |
| y_axis | str | "counts" |
Unit for the Y axis |
| device | str | None | Identifier of the device that took the measurement |
| meta | dict[str, any] | {} |
Spectrometer-specific metadata |
GPLv3
Footnotes
-
Discussed in the Software Hacks Unlock Cheap Spectrometer article. ↩