A simple desktop UI for multilayer thin-film optical mapping using the transfer matrix method (TMM) and a local optical-constants database based on refractiveindex.info data.
This tool is designed for quick and easy generation of wavelength-angle maps of:
- Reflectivity
R - Emissivity
E = 1 - R
It is intended for practical exploration of:
- multilayer thin films
- angle-dependent optics
- infrared emissivity
- thermal-radiation-related optical design
- planar metamaterial / coating prototyping
Many TMM-based tools already exist, but they are often code-first or inconvenient for quick visual exploration.
This project focuses on a more accessible workflow:
- simple desktop UI
- direct material selection
- multilayer stack setup without manual scripting
- quick 2D optical mapping
- optional overlay tools for visual analysis
- built-in material-data browsing
The goal is not to replace advanced simulation frameworks, but to make thin-film optical mapping faster and easier to use.
- Desktop GUI built with PySide6
- Multilayer thin-film optics using transfer matrix method
- Local optical-constants lookup through a database wrapper
- Generates wavelength-angle maps
- Supports:
- s polarization
- p polarization
- both (average of s and p)
- Switches between:
- Reflectivity
- Emissivity
- Optional overlays:
- Contour
- Submask
- Peak
- Built-in material browser for plotting:
n(λ)k(λ)
- Export figures as:
- PNG
- SVG
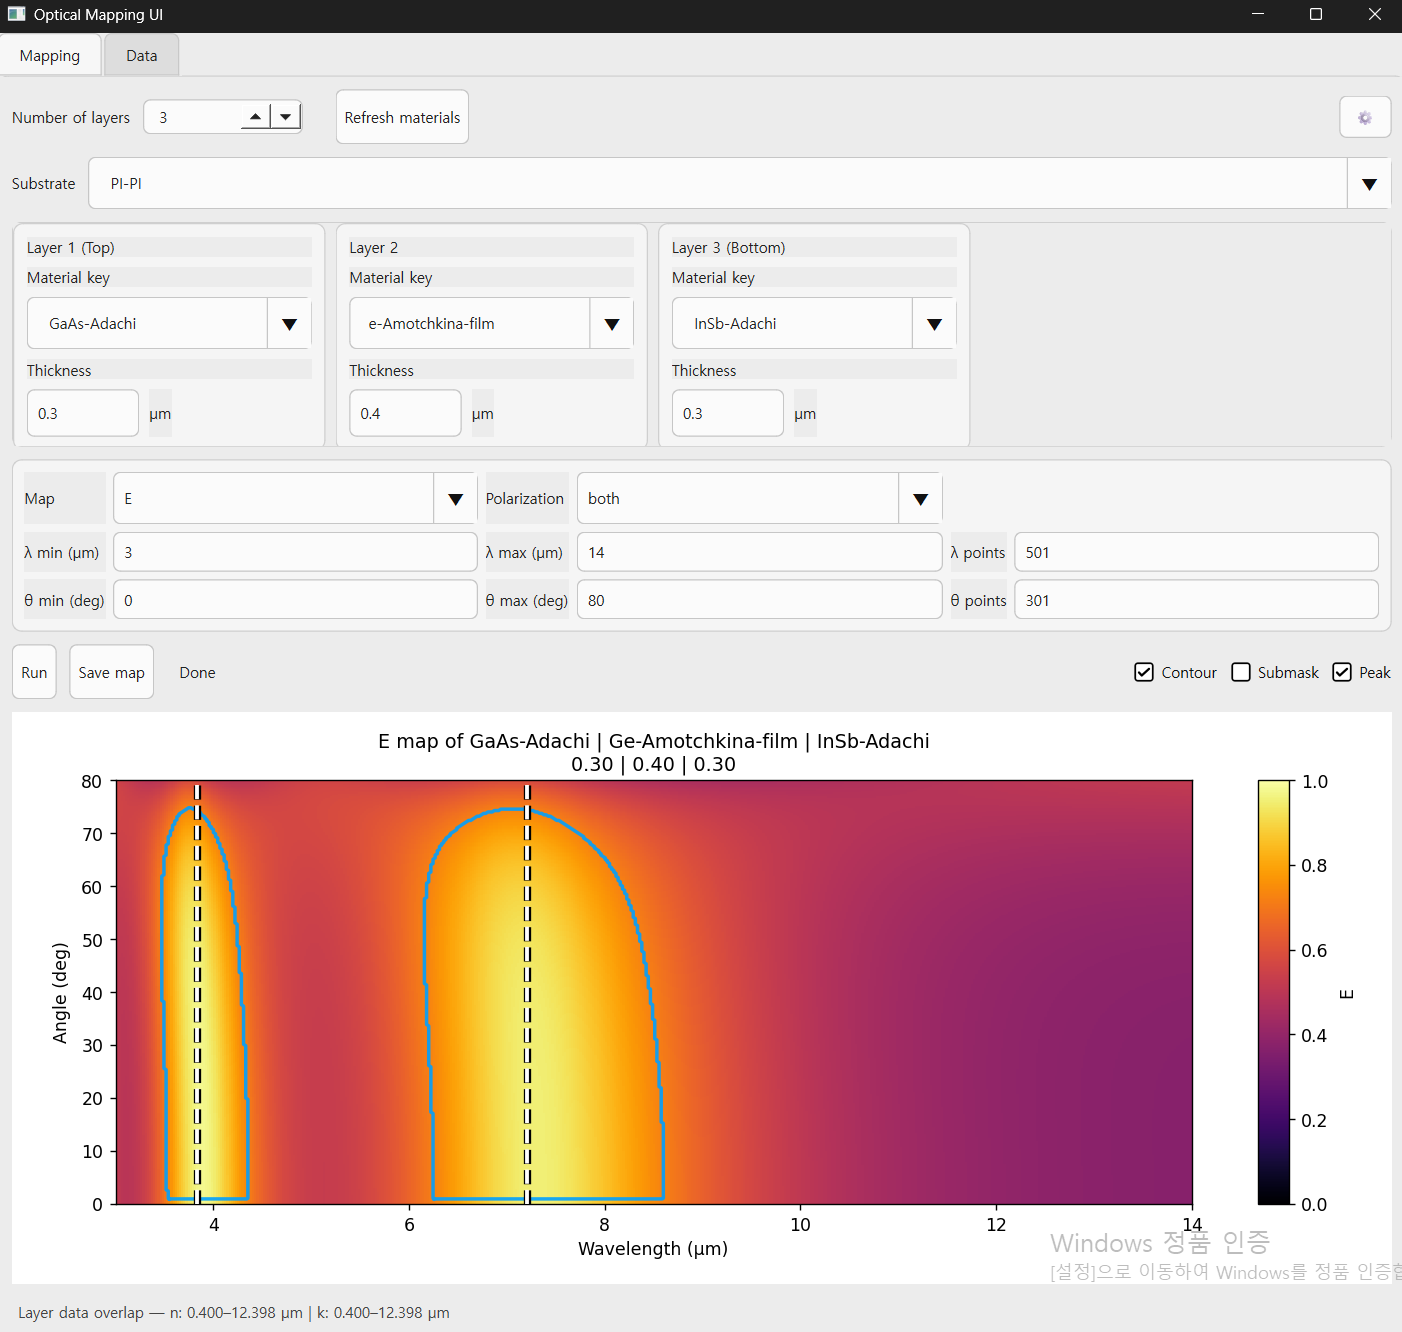
The program has two main tabs.
This is the main simulation UI.
You can:
- choose a substrate
- choose the number of layers
- assign a material to each layer
- set layer thicknesses in µm
- define wavelength range and sampling
- define angle range and sampling
- choose:
- E or R
- s, p, or both
The program then computes a 2D map over wavelength and incidence angle.
That means you can quickly visualize how a multilayer stack behaves spectrally and angularly, which is useful for:
- emissivity design
- reflectivity analysis
- stack comparison
- thin-film screening
Optional overlays can be enabled to help inspect strong features in the map.
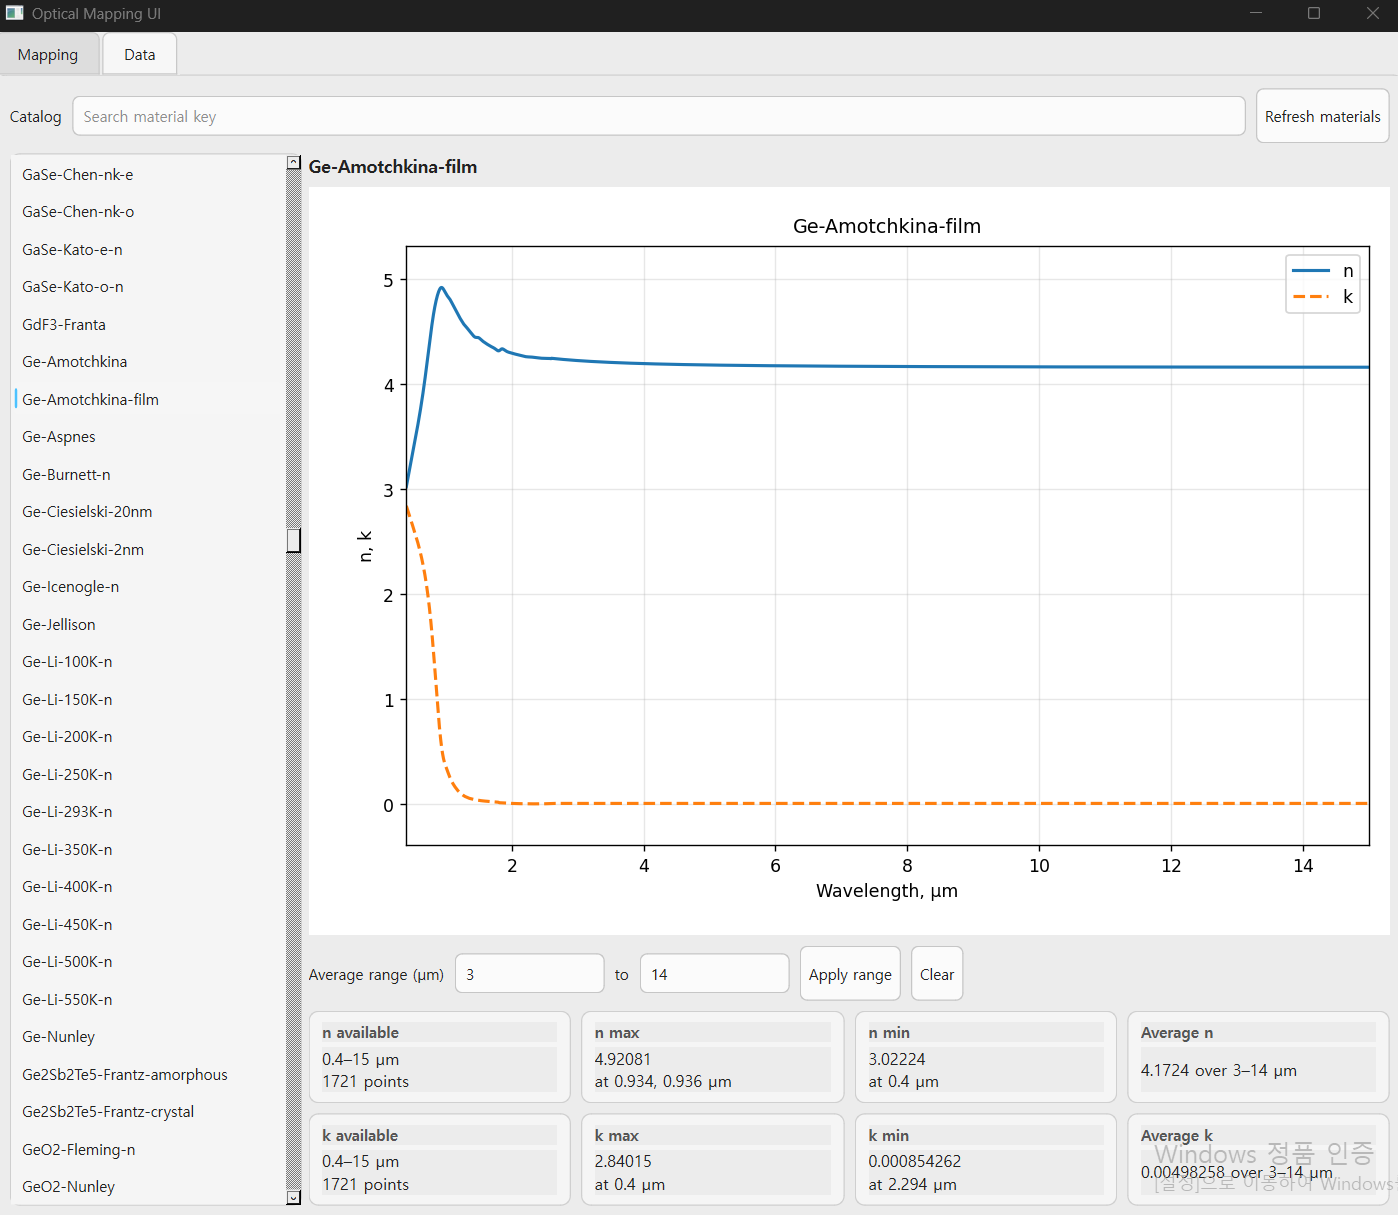
This tab is for browsing material optical data.
For each material key, the program can display:
- refractive index
n - extinction coefficient
k - wavelength range
- max/min values
- average values over a user-selected wavelength interval
This is useful when selecting candidate materials before building a multilayer stack.
The program uses the transfer matrix method (TMM) for planar multilayer structures.
For a given stack, it computes the complex reflection coefficient and then evaluates:
- Reflectivity:
R = |r|^2 - Emissivity:
E = 1 - R
For both polarization, the displayed result is based on the average of the s- and p-polarized reflectivities.
So this tool is mainly suited for:
- planar multilayer optical systems
- angle-resolved reflectivity/emissivity studies
- rapid material/thickness exploration
Main files in this project:
-
UI.py
Main entry point. Run this file to start the app. -
TMM.py
Transfer matrix method engine. -
nkwrap.py
Optical-constants lookup and interpolation wrapper. -
map_mod.py
Map-generation logic for reflectivity/emissivity. -
contour.py
Contour-style overlay generation. -
submask.py
Submask extraction from map features. -
simplepeak.py
1D peak detection helper. -
material_keys_tagged.txt
Tagged material-key list. -
data_f.sqlite
Local optical-constants database.
-
Download this repository.
- Either download it as a ZIP from GitHub and extract it, or clone it with Git:
-
Download the database file
data_f.sqlitefrom the Google Drive link below:
https://drive.google.com/file/d/13pP8PzNkjb4EwtVwyAV_BmgWK-LTkl8E/view?usp=drive_link
- Place
data_f.sqlitein the same folder as the main Python files.
Your folder should look like this:
Multilayer-Mapping-UI/
├─ UI.py
├─ TMM.py
├─ nkwrap.py
├─ map_mod.py
├─ contour.py
├─ submask.py
├─ simplepeak.py
├─ material_keys_tagged.txt
├─ data_f.sqlite
├─ requirements.txt
└─ README.md
Run the program with:
python UI.pyThis launches the GUI.
UI.pyis the main entry point of the application.data_f.sqliteis required for the material database and optical-constants lookup.- The database file is not included directly in this repository because of file size.
- If
data_f.sqliteis missing or placed in the wrong folder, the program may not work correctly.
- Python 3.10+
numpyscipymatplotlibPySide6
Install dependencies with:
pip install -r requirements.txt