Data Analyst | Power BI & Python Enthusiast | Turning Data into Insights
From João Pessoa, Brazil (UTC−03)
I’m a data analyst passionate about transforming raw information into clear, actionable insights.
I focus on clean data models, clear KPIs, and pragmatic storytelling that drive decisions.
- 🐍 Python for Data Science (Pandas, NumPy, Matplotlib, Seaborn)
- 📊 Visualization (Power BI, Tableau)
- 🧱 SQL for querying & modeling
- 🧭 Dashboards that support decision-making
Domain: Urban & Real Estate • Stack: Tableau, Python (prep), Excel • Focus city: João Pessoa (PB)
Three stories analyzing Brazilian capitals in 2025, highlighting João Pessoa as a prime city to live and invest — combining low cost of living, high appreciation, and top STR yield.
🔗 Tableau Public (all stories):
https://public.tableau.com/app/profile/diego.porto.de.vasconcelos.ribeiro/vizzes
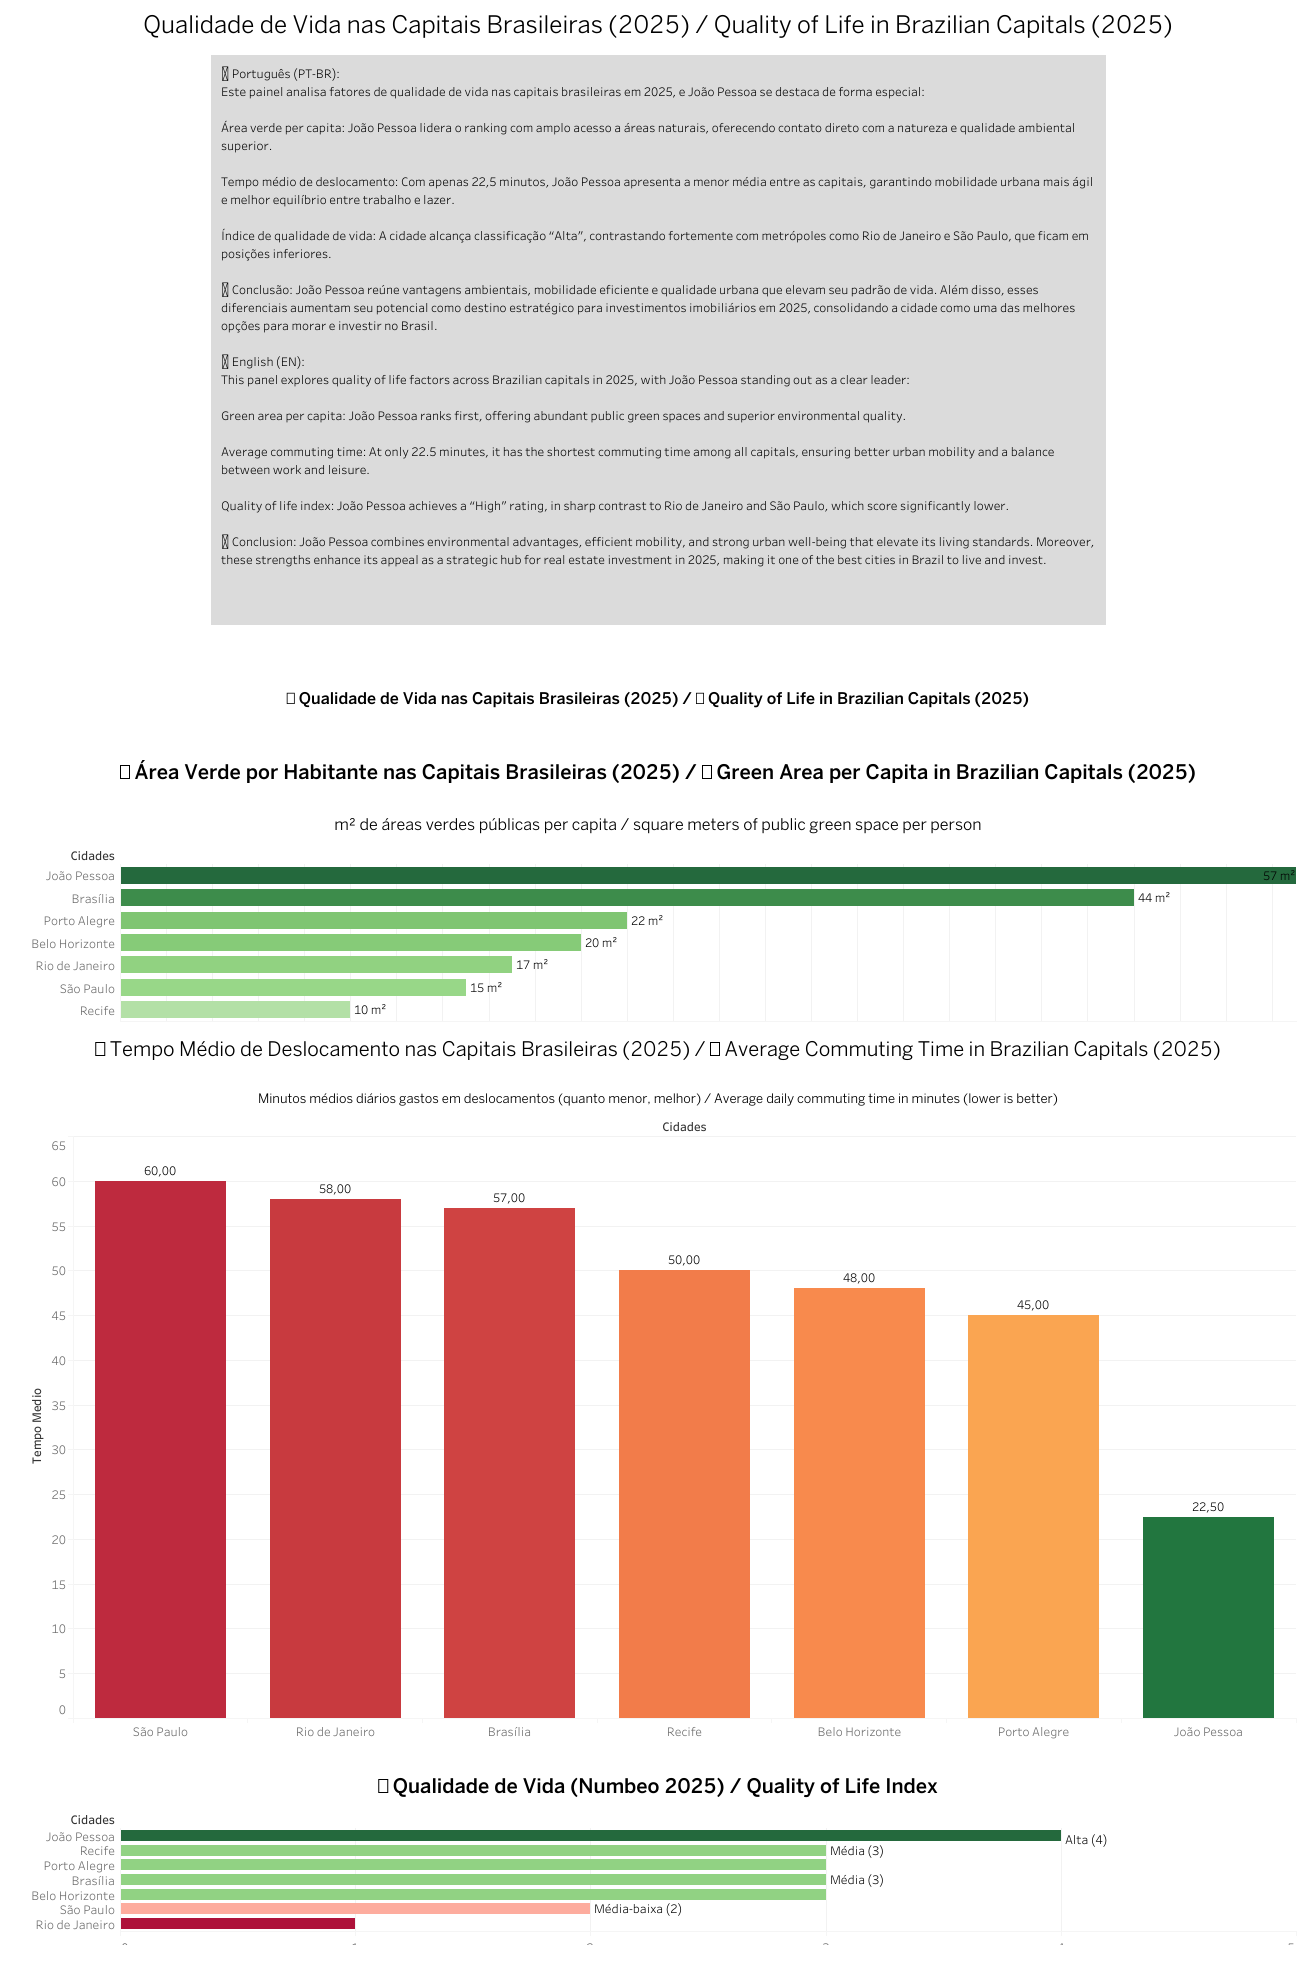
1) Quality of Life in Brazilian Capitals (2025)
- Green area per capita • Average commuting time • Numbeo index
- João Pessoa leads on mobility & overall quality
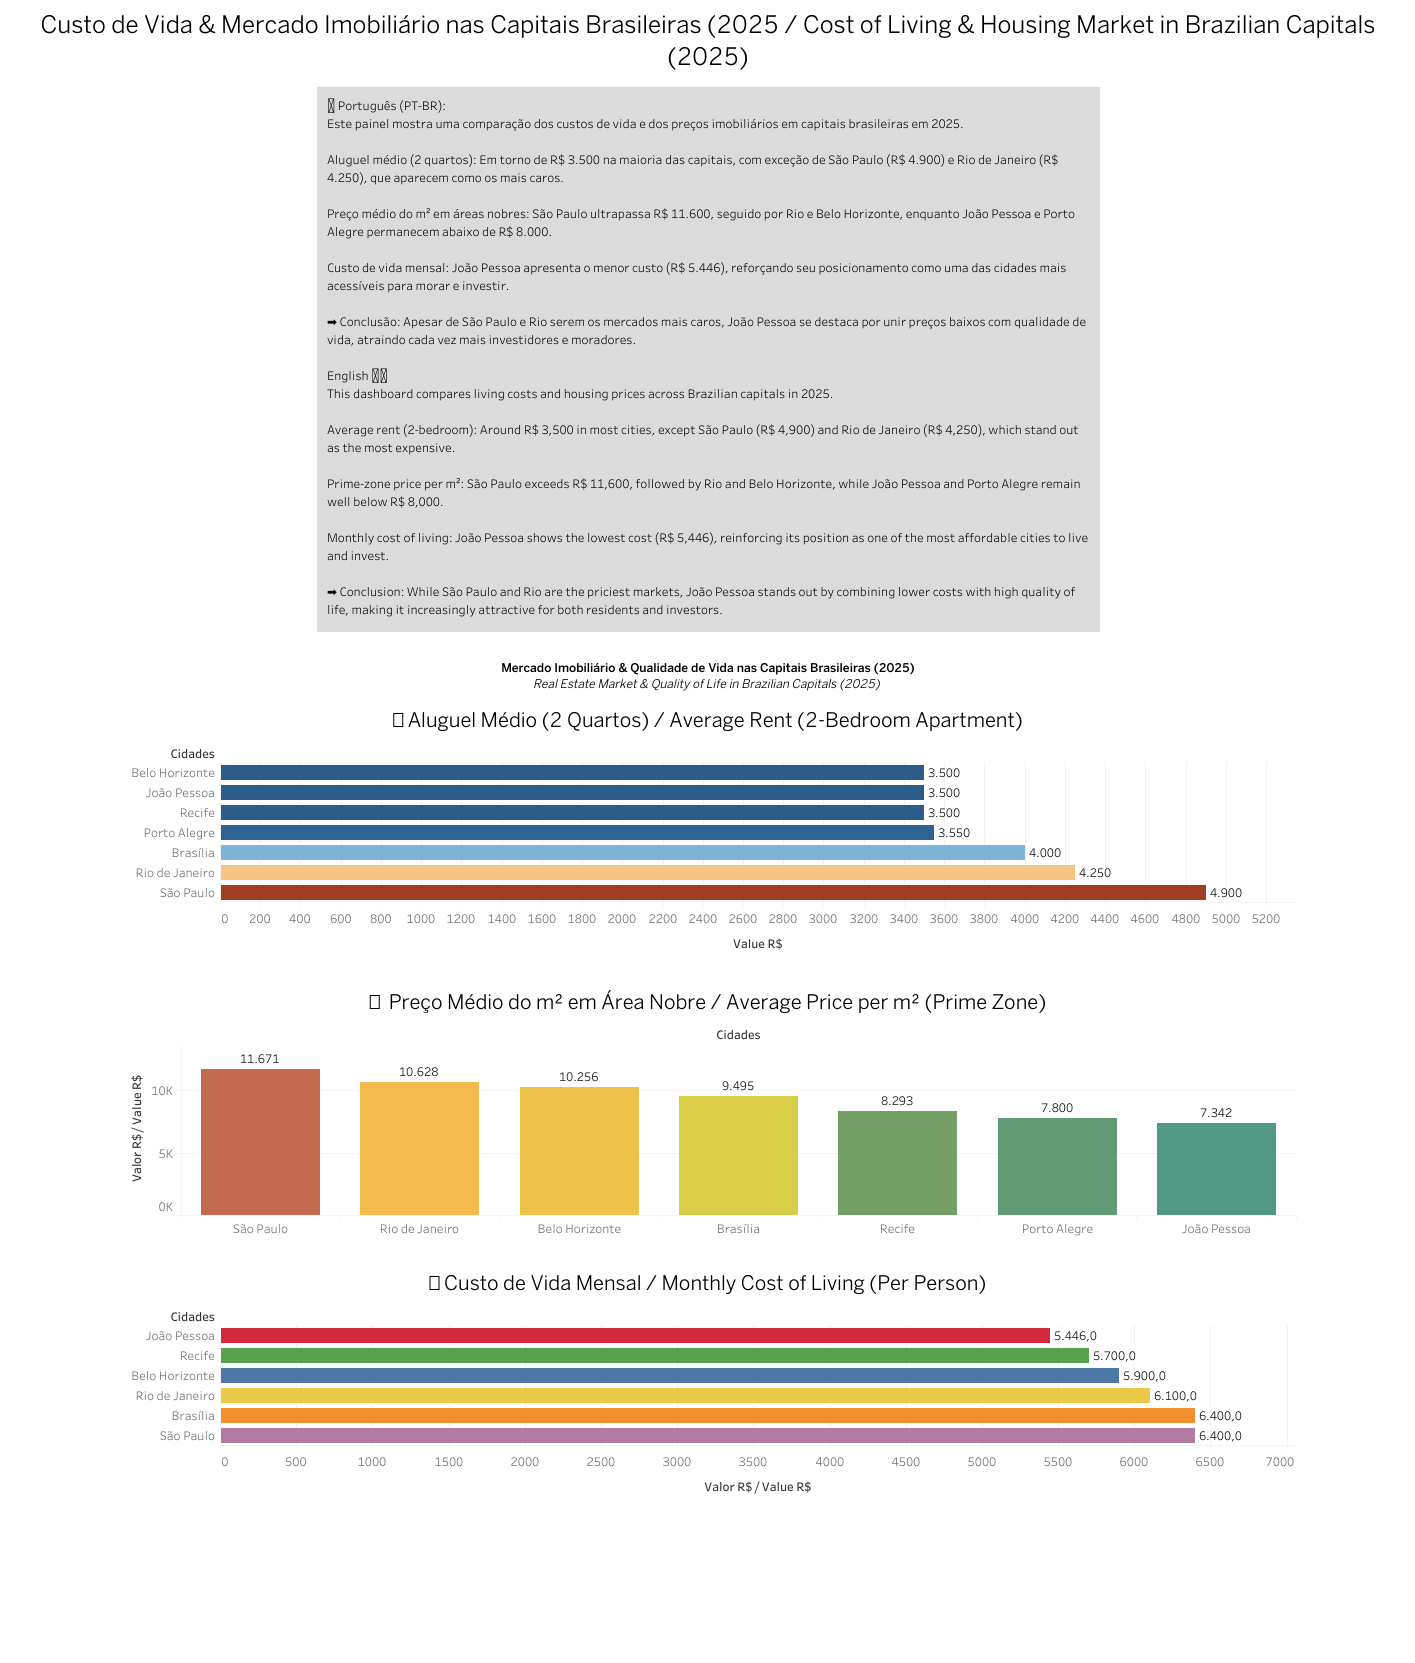
2) Cost of Living & Housing Market (2025)
- Rent for 2BR • Prime-zone price per m² • Monthly cost per person
- João Pessoa remains affordable vs. SP/RJ
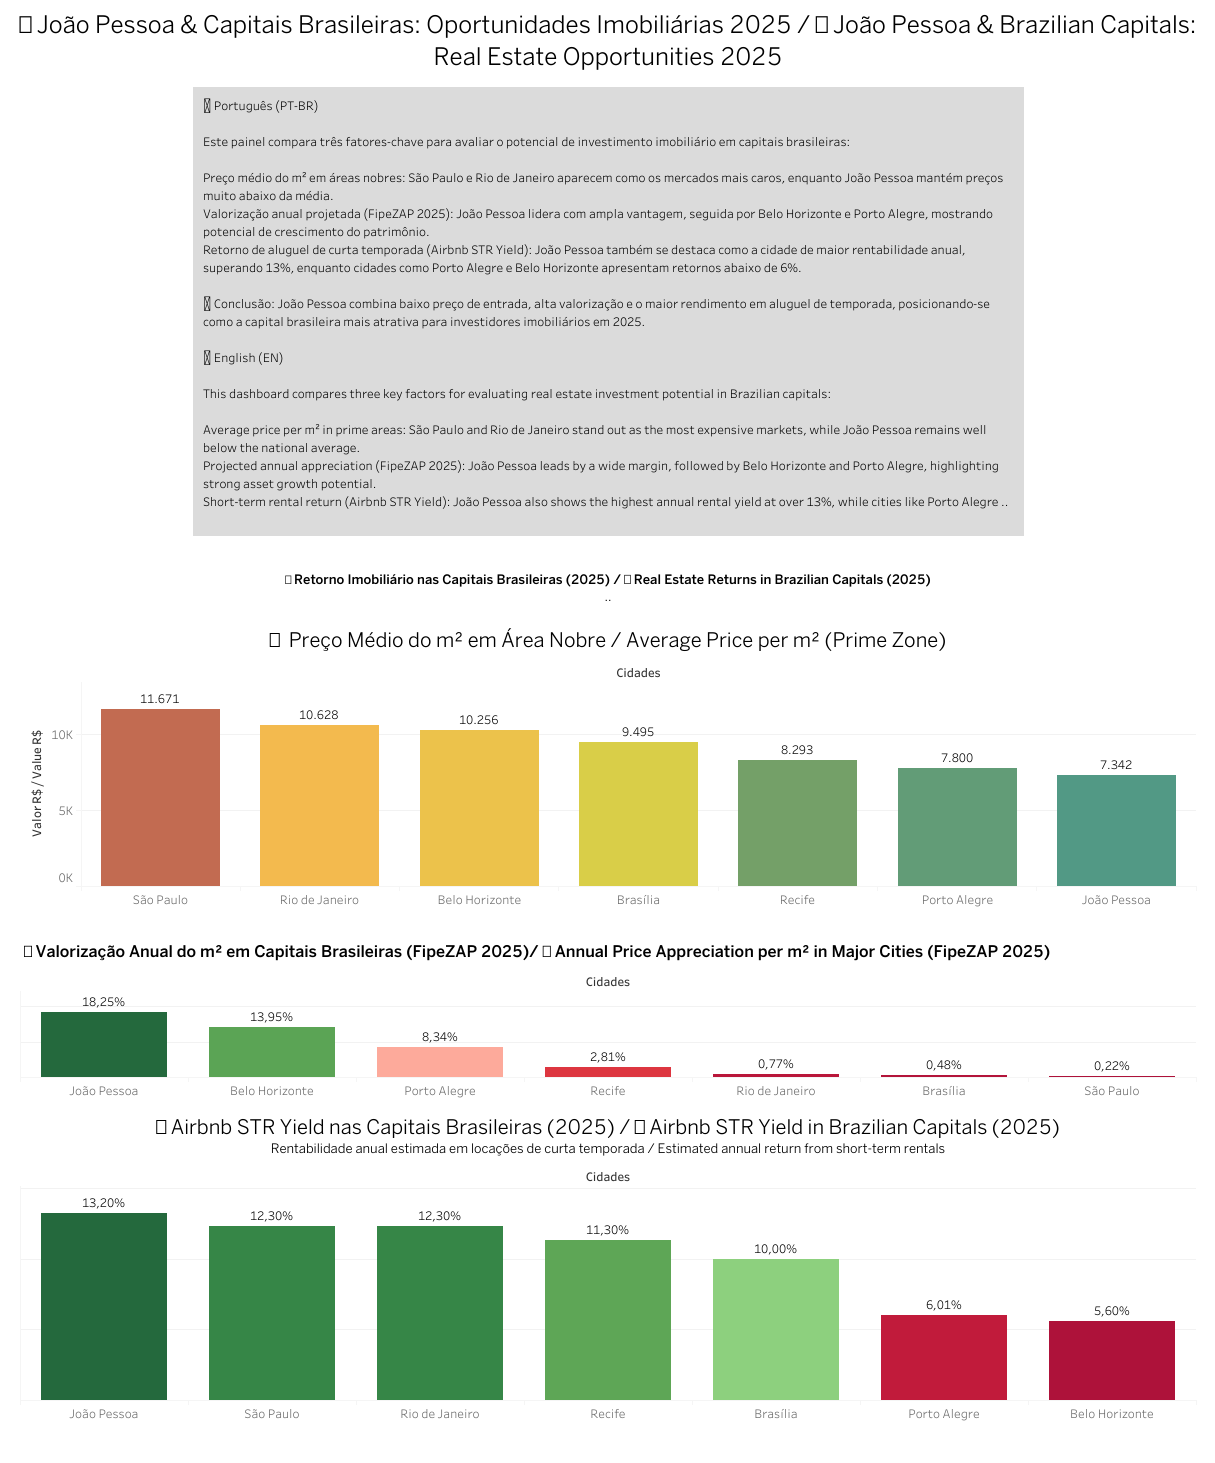
3) Real Estate Opportunities 2025
- Prime m² price • Annual appreciation (FipeZAP) • Airbnb STR Yield
- João Pessoa: 18.25% appreciation + 13% STR yield
Domain: People Analytics • Stack: Power BI, Power Query, SQL • Dataset: IBM HR (public)
Explored attrition drivers (overtime, travel frequency, compa-ratio).
Segmented risk cohorts and proposed retention levers prioritized by impact vs. cost.
Live demos
Links:
- 📊 View Dashboard (PBIX):
Download - 📁 GitHub Repo:
https://github.com/diegoporto10/hr-analytics-attrition - 📝 Case Study:
See assets & notes in the repo README
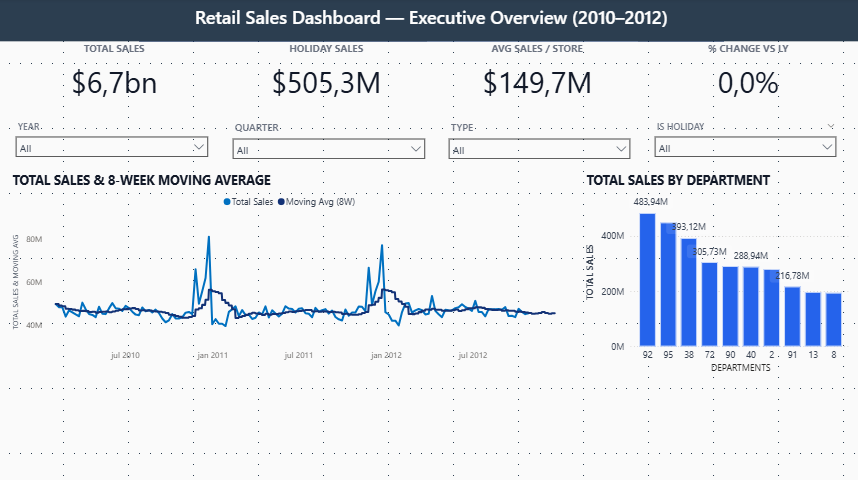
Domain: Retail • Stack: Power BI, DAX, Excel • Dataset: Kaggle (5k+ rows)
Identified a 12% MoM drop tied to stockouts; recommended inventory buffer & vendor consolidation.
Links:
- 📊 View Dashboard (PBIX):
Download - 📁 GitHub Repo:
https://github.com/diegoporto10/retail-sales-intelligence-pbi - 📝 Case Study:
https://github.com/diegoporto10/retail-sales-intelligence-pbi/blob/main/docs/case-study.md
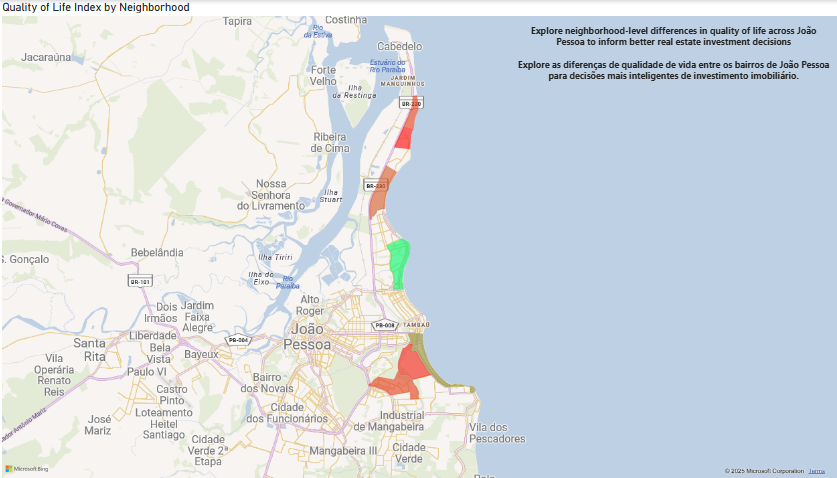
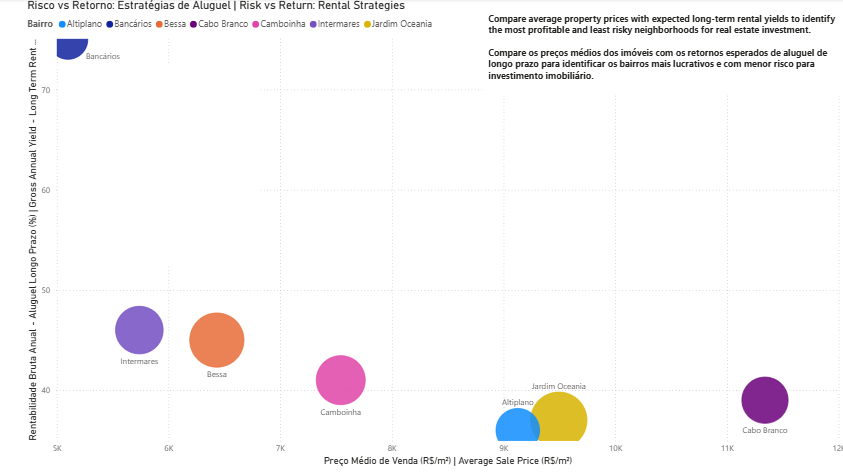
Domain: Real Estate • Stack: Power BI, Python (Pandas, Matplotlib), SQL • Dataset: Local listings & indexes
Analyzed João Pessoa’s housing market, with focus on:
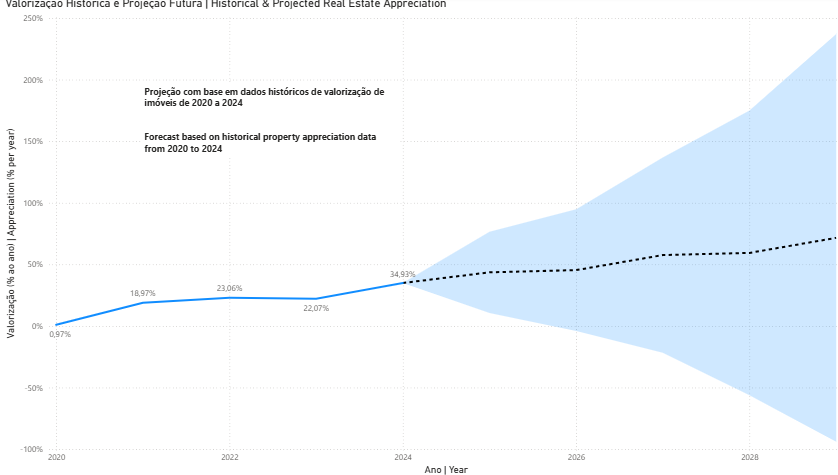
- 📈 Property appreciation trends
- ⚖️ Risk vs. return analysis
- 🏙 Quality of life index by neighborhood
Links:
- 📊 View Dashboard (PBIX):
Download - 📁 GitHub Repo:
https://github.com/diegoporto10/joao-pessoa-real-estate - 📄 Report (PDF):
Quality of Life Index (Download)
Goal: Reusable Pandas pipeline for fast data cleaning (rename/trim, type fixing, dedupe, coercions, and deriving age/tenure bands).
Repo: https://github.com/diegoporto10/data-cleaning-python
Quickstart (Windows / PowerShell):
# 1) Create & activate venv
python -m venv .venv &&
.\.venv\Scripts\activate

# 2) Install dependencies
pip install -r requirements.txt

# 3) Run cleaner
python src\clean.py --input data\raw\sample.csv ^
                    --output data\processed\clean.csv ^
                    --int-cols age,years_at_company