


Compare ML training runs side-by-side in VS Code - no browser switching, no waiting
Stop switching to your browser to compare training runs. Bread Wandb Viewer brings Weights & Biases visualization directly into VS Code. Compare multiple runs side-by-side with interactive charts, export AI context for Claude Code/Cursor/Codex, and analyze experiments without leaving your editor.
Perfect for machine learning engineers, deep learning researchers, and data scientists who want to stay in their development environment.
 View multiple training runs in seconds - no browser needed
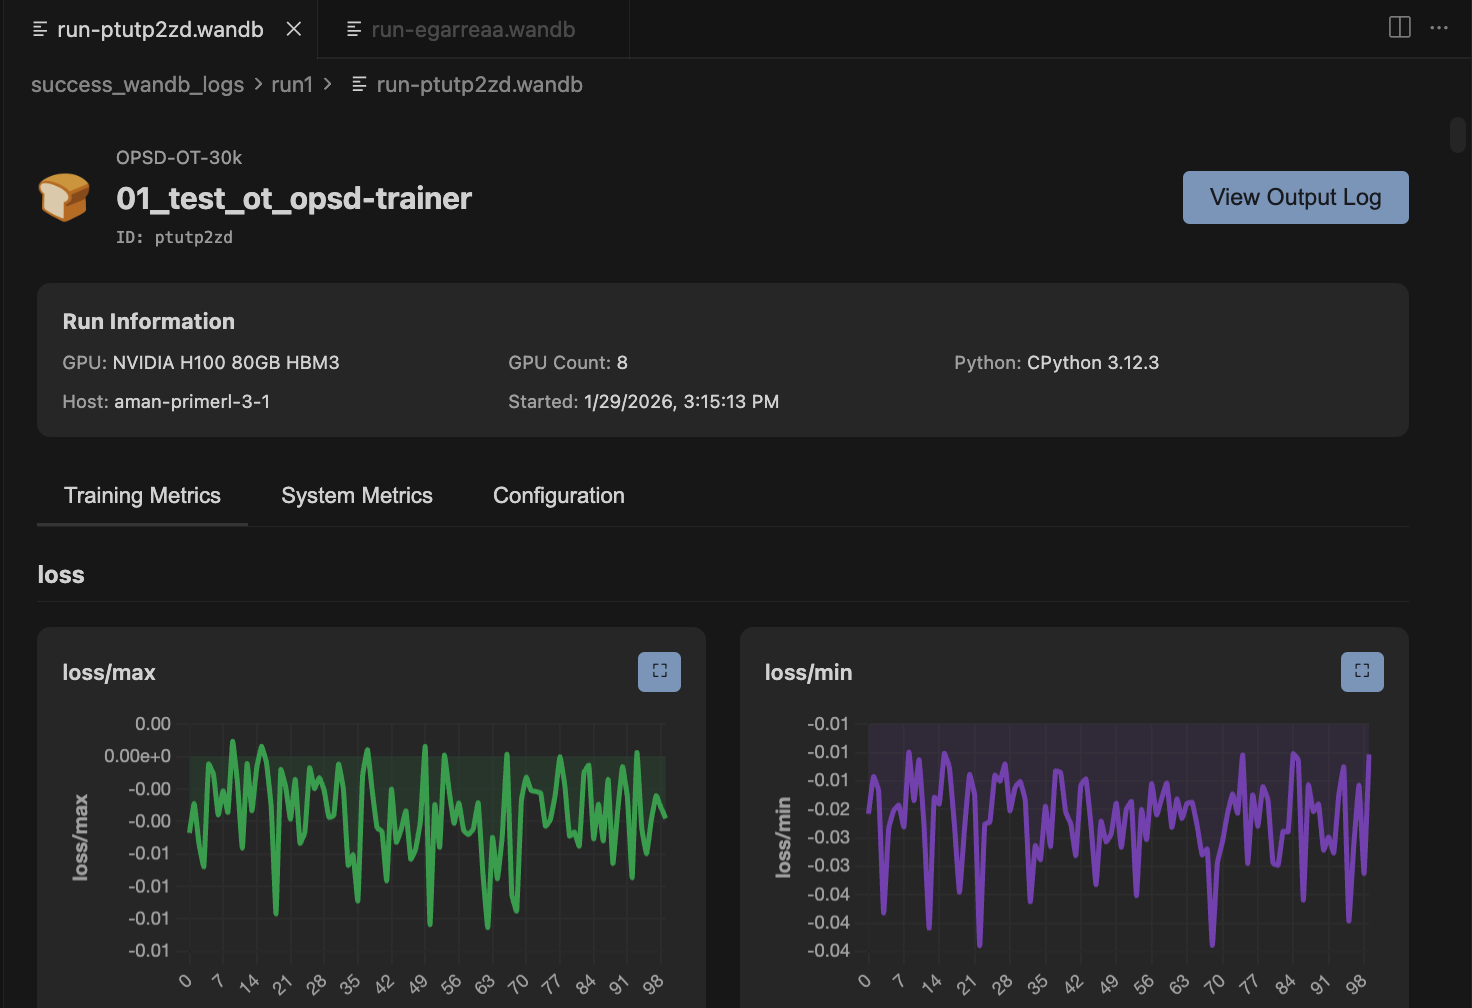 Compare W&B training metrics with interactive sidebar
- 🔄 Multi-Run Comparison - Overlay multiple runs on the same charts with color coding and interactive toggles
- 🤖 AI Context Export - One-click markdown export for Claude Code, Cursor, and Codex with token counting
- 🎯 Interactive Charts - Zoom, pan, fullscreen, and smooth with EMA (exponential moving average)
- 📂 Automatic File Watching - Extension detects new .wandb files and refreshes automatically
- 📊 System Metrics - GPU utilization, memory, CPU, disk I/O tracking
- 🔍 Metadata Comparison - Side-by-side config and hyperparameter diff highlighting
- 🎨 Smart Grouping - Metrics auto-organized by prefix (loss/, train/, val/, gpu.0/)
- 🔒 100% Offline - Direct .wandb file parsing with protobuf, no API calls or internet needed
- 🎛️ Advanced Controls - Log scales, raw data overlay toggle, adjustable smoothing
- 📁 Folder Scanning - Automatically discover all runs in a directory
View a single run:
- Click any
.wandbfile in VS Code Explorer - Charts and metrics appear instantly
Compare multiple runs:
- Right-click any folder with W&B runs
- Select "Bread Wandb Viewer"
- Check/uncheck runs in sidebar to compare
That's it! No configuration needed.
 One-click AI context export for Claude Code, Cursor, and Codex
Compare training runs side-by-side to understand what hyperparameters and configurations work best - all without leaving VS Code.
- Overlay multiple runs on the same charts
- Color-coded run identification
- Interactive sidebar for toggling runs on/off
- Resizable sidebar for better workspace management
- Automatic folder scanning for all runs
Ideal for hyperparameter tuning, ablation studies, and experiment analysis. No need to switch to your browser to compare metrics.
Export your training runs as AI-optimized markdown for coding assistants like Claude Code, Cursor, and Codex.
Perfect for:
- Debugging training code with AI assistance
- Analyzing hyperparameter impact on model performance
- Generating experiment summaries and insights
- Understanding why certain runs performed better
Features:
- One-click copy to clipboard or save to file
- Token count estimation for context planning
- Formatted comparison tables
- CSV metric data for analysis
- Configuration diffs highlighted
Advanced chart controls for detailed metric analysis.
- Smoothing: Adjustable EMA smoothing with real-time preview
- Zoom: Drag to select region and zoom in
- Pan: Shift+drag to navigate zoomed charts
- Fullscreen: Click expand icon on any chart
- Log Scales: Toggle X and Y axis logarithmic scales
- Raw Data Overlay: View smoothed and raw data simultaneously
- Auto-decimation: Large datasets (500+ points) automatically downsampled for performance
The extension automatically detects when new .wandb files are created or updated and refreshes the view without manual intervention.
- No refresh button needed
- Works seamlessly with running training scripts
- Detects new runs added to folders
- Updates existing run views when files change
View comprehensive run information beyond just training metrics.
Run Metadata:
- GPU type and count
- Python version
- CPU count and CUDA version
- Git remote and commit
- Runtime start timestamp
System Metrics:
- GPU utilization and memory
- CPU usage
- Disk I/O
- Memory consumption
Your training data never leaves your machine.
- Reads
.wandbfiles directly using protobuf - No wandb CLI or API needed
- No internet connection required
- Works completely offline
- Zero telemetry on your training data (see Privacy section below)
Install from the VS Code Marketplace, or download the .vsix from releases:
code --install-extension wandb-viewer-0.2.2.vsix- VS Code 1.74.0 or higher
- Training runs created with wandb SDK 0.15+
| Command | How to Access | Description |
|---|---|---|
| Bread Wandb Viewer | Right-click folder in Explorer | Opens multi-run comparison view for all .wandb files in folder |
| Open .wandb file | Click any .wandb file |
Opens single run view with charts and metadata |
| Action | Shortcut |
|---|---|
| Zoom into region | Click chart + drag |
| Pan across chart | Shift + drag |
| Reset zoom | Double-click chart |
This extension collects anonymous usage analytics to help improve the product. We take your privacy seriously.
- Feature usage (which features you use)
- Performance metrics (parse times, load times)
- Error events (crashes and bugs)
- Chart interactions (smoothing settings, zoom actions)
- ❌ Run names or project names
- ❌ Metric values or training data
- ❌ File paths or code
- ❌ Hyperparameters or configurations
- ❌ Any personally identifiable information (PII)
Option 1: Via Settings UI
- Open Settings (
Cmd+,orCtrl+,) - Search for "telemetry level"
- Set Telemetry Level to "off"
Option 2: Via settings.json
- Open Command Palette (
Cmd+Shift+P/Ctrl+Shift+P) - Type "Preferences: Open User Settings (JSON)"
- Add:
"telemetry.telemetryLevel": "off"
The extension respects your editor's global telemetry.telemetryLevel setting. Learn more about VS Code telemetry.
For developers and power users interested in how this extension works.
- Binary Parsing: Direct protobuf parsing of
.wandbfiles (LevelDB-style format) - No Dependencies: No wandb CLI, API, or internet connection required
- Performance: LRU cache (20 runs), LTTB decimation for large datasets, lazy chart initialization
- File Watching: Automatic detection of file changes with 1-second debouncing
- Chart Library: Chart.js 4.4.0 with zoom plugin for interactive visualizations
- HistoryRecord (per-step training metrics)
- ConfigRecord (hyperparameters)
- SummaryRecord (final summary stats)
- StatsRecord (system statistics)
- EnvironmentRecord (Python, GPU, host metadata)
- RunRecord (project name, run ID, display name)
- And 15+ other internal record types
- Quick Metadata: Reads only first 16KB for fast folder scanning
- Metric Decimation: LTTB algorithm for datasets >500 points
- Lazy Loading: Charts initialized only when visible
- LRU Cache: Parsed run data cached (max 20 runs)
- Debounced Updates: File changes debounced to 1 second
- ✅ Current version: 0.2.2
- ✅ Compatible with VS Code 1.74+
- ✅ Tested with wandb SDK 0.15+
- ✅ Open Source - contributions welcome
Found a bug or have a feature request?
- Report Issues: GitHub Issues
- Pull Requests: Contributions welcome!
- Documentation: Source Code
Problem: Switching between VS Code and your browser to compare training runs breaks your flow and slows down iteration.
Solution: View and compare everything in VS Code. Multi-run comparison, AI context generation, and interactive charts - all without leaving your editor.
Result: Stay focused, iterate faster, and leverage AI coding assistants to analyze your experiments.
Made with ❤️ by Bread Technologies